AI ANALYSIS & REPORTING
4,000 comments. Analyzed before lunch.
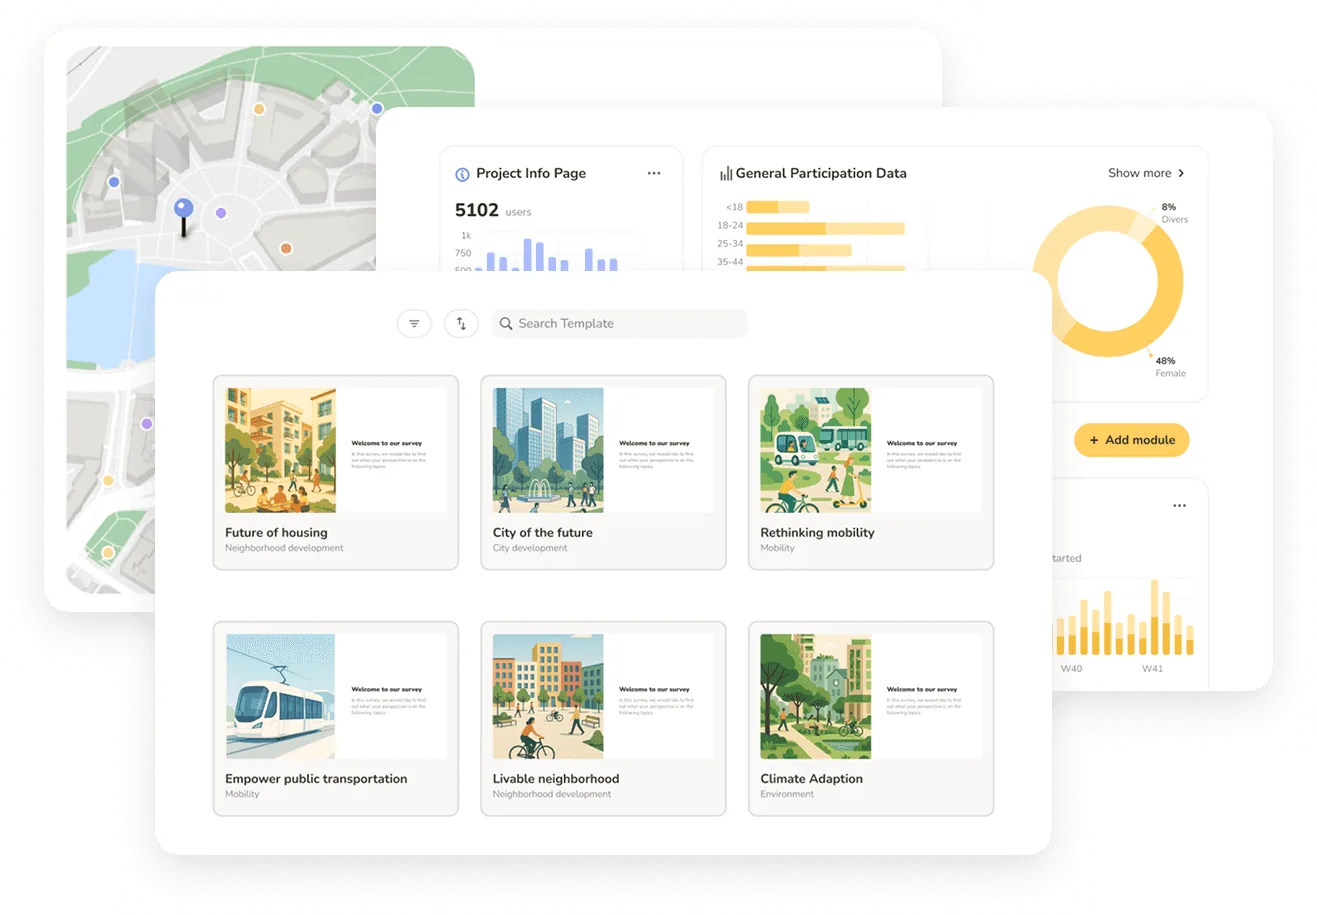
The analysis and reporting layer planning firms have been doing in Excel — now built into the platform. AI-categorized open text, branded charts that update in real time, and live ArcGIS Online sync.
AI categorization
Open-text responses and Dialogue Map comments auto-categorized at submission. Edit or reassign manually where context matters.
Live charts & heatmaps
Pie, bar, heatmap, word cloud – every visualization updates in real time as data comes in or filters change.
Export-ready for GIS and clients
PNG and SVG charts, full project ZIP, survey data as Excel — everything your client needs. Spatial responses sync live into ArcGIS Online and export as GeoJSON or Shapefile.
AI ANALYSIS & REPORTING
4,000 comments. Analyzed before lunch.
The analysis and reporting layer planning firms have been doing in Excel — now built into the platform. AI-categorized open text, branded charts that update in real time, and live ArcGIS Online sync.
AI categorization
Open-text responses and Dialogue Map comments auto-categorized at submission. Edit or reassign manually where context matters.
Live charts & heatmaps
Pie, bar, heatmap, word cloud – every visualization updates in real time as data comes in or filters change.
Export-ready for GIS and clients
PNG and SVG charts, full project ZIP, survey data as Excel — everything your client needs. Spatial responses sync live into ArcGIS Online and export as GeoJSON or Shapefile.
AI ANALYSIS & REPORTING
4,000 comments. Analyzed before lunch.
The analysis and reporting layer planning firms have been doing in Excel — now built into the platform. AI-categorized open text, branded charts that update in real time, and live ArcGIS Online sync.
AI categorization
Open-text responses and Dialogue Map comments auto-categorized at submission. Edit or reassign manually where context matters.
Live charts & heatmaps
Pie, bar, heatmap, word cloud – every visualization updates in real time as data comes in or filters change.
Export-ready for GIS and clients
PNG and SVG charts, full project ZIP, survey data as Excel — everything your client needs. Spatial responses sync live into ArcGIS Online and export as GeoJSON or Shapefile.
Stop losing margin to comment categorization.
On fixed-fee contracts, open-text analysis is non-billable. A 2,000-response project burns 1-2 days. A comprehensive plan burns a week. Senf cuts that to hours not days – AI categorizes at submission, you review and adjust where context matters.
Filter everything. Compare anything.
Filter by demographic, geography, AI tag, or cross-question response. Split any chart by group to compare responses side by side. Change a filter, the charts follow. Change a category, the word cloud follows.
Charts that are the deliverable.
Most firms rebuild every chart in Excel or PowerPoint to make it client-ready. The charts in Senf come branded, styled, and exportable. Export individual charts as PNG or SVG – or every chart in the project as one ZIP. Drop SVGs into Illustrator without rebuilding.
Spatial output your GIS team can use.
Heatmaps by mode – walking, cycling, driving – and by demographic. Spatial responses sync live into ArcGIS Online as they arrive, and export as GeoJSON or Shapefile for ArcGIS or QGIS.
Stop losing margin to comment categorization.
On fixed-fee contracts, open-text analysis is non-billable. A 2,000-response project burns 1-2 days. A comprehensive plan burns a week. Senf cuts that to hours not days – AI categorizes at submission, you review and adjust where context matters.
Filter everything. Compare anything.
Filter by demographic, geography, AI tag, or cross-question response. Split any chart by group to compare responses side by side. Change a filter, the charts follow. Change a category, the word cloud follows.
Charts that are the deliverable.
Most firms rebuild every chart in Excel or PowerPoint to make it client-ready. The charts in Senf come branded, styled, and exportable. Export individual charts as PNG or SVG – or every chart in the project as one ZIP. Drop SVGs into Illustrator without rebuilding.
Spatial output your GIS team can use.
Heatmaps by mode – walking, cycling, driving – and by demographic. Spatial responses sync live into ArcGIS Online as they arrive, and export as GeoJSON or Shapefile for ArcGIS or QGIS.
Stop losing margin to comment categorization.
On fixed-fee contracts, open-text analysis is non-billable. A 2,000-response project burns 1-2 days. A comprehensive plan burns a week. Senf cuts that to hours not days – AI categorizes at submission, you review and adjust where context matters.
Filter everything. Compare anything.
Filter by demographic, geography, AI tag, or cross-question response. Split any chart by group to compare responses side by side. Change a filter, the charts follow. Change a category, the word cloud follows.
Charts that are the deliverable.
Most firms rebuild every chart in Excel or PowerPoint to make it client-ready. The charts in Senf come branded, styled, and exportable. Export individual charts as PNG or SVG – or every chart in the project as one ZIP. Drop SVGs into Illustrator without rebuilding.
Spatial output your GIS team can use.
Heatmaps by mode – walking, cycling, driving – and by demographic. Spatial responses sync live into ArcGIS Online as they arrive, and export as GeoJSON or Shapefile for ArcGIS or QGIS.

"In the past we would bake in 80 hours of post-production to go through the survey information and make heads or tails of it. Now it's just done."
Brian Reetz
Principal, Design Collective
"In the past we would bake in 80 hours of post-production to go through the survey information and make heads or tails of it. Now it's just done."
Brian Reetz
Principal, Design Collective
"In the past we would bake in 80 hours of post-production to go through the survey information and make heads or tails of it. Now it's just done."
Brian Reetz
Principal, Design Collective