2,201
Residents started
1,436
Residents completed
65.2%
Completion rate
10m 32s
Average time
Park and public-space redesign · Frederick, Maryland · 2026Design Collective website
Send a plan or RFPContents
Survey welcome page
How they won the project
It started in the proposal. Before the project existed, Design Collective included a working Senf survey in its response to the solicitation: a live link decision makers could click and try, in place of a paragraph describing an engagement plan. The client tested the survey before the job was awarded.
We used the survey as a differentiator and as bait to tease the client and give them a reason to remember us. Of course this meant a little upfront effort on our part.
A downtown park, and a lot of ground to cover
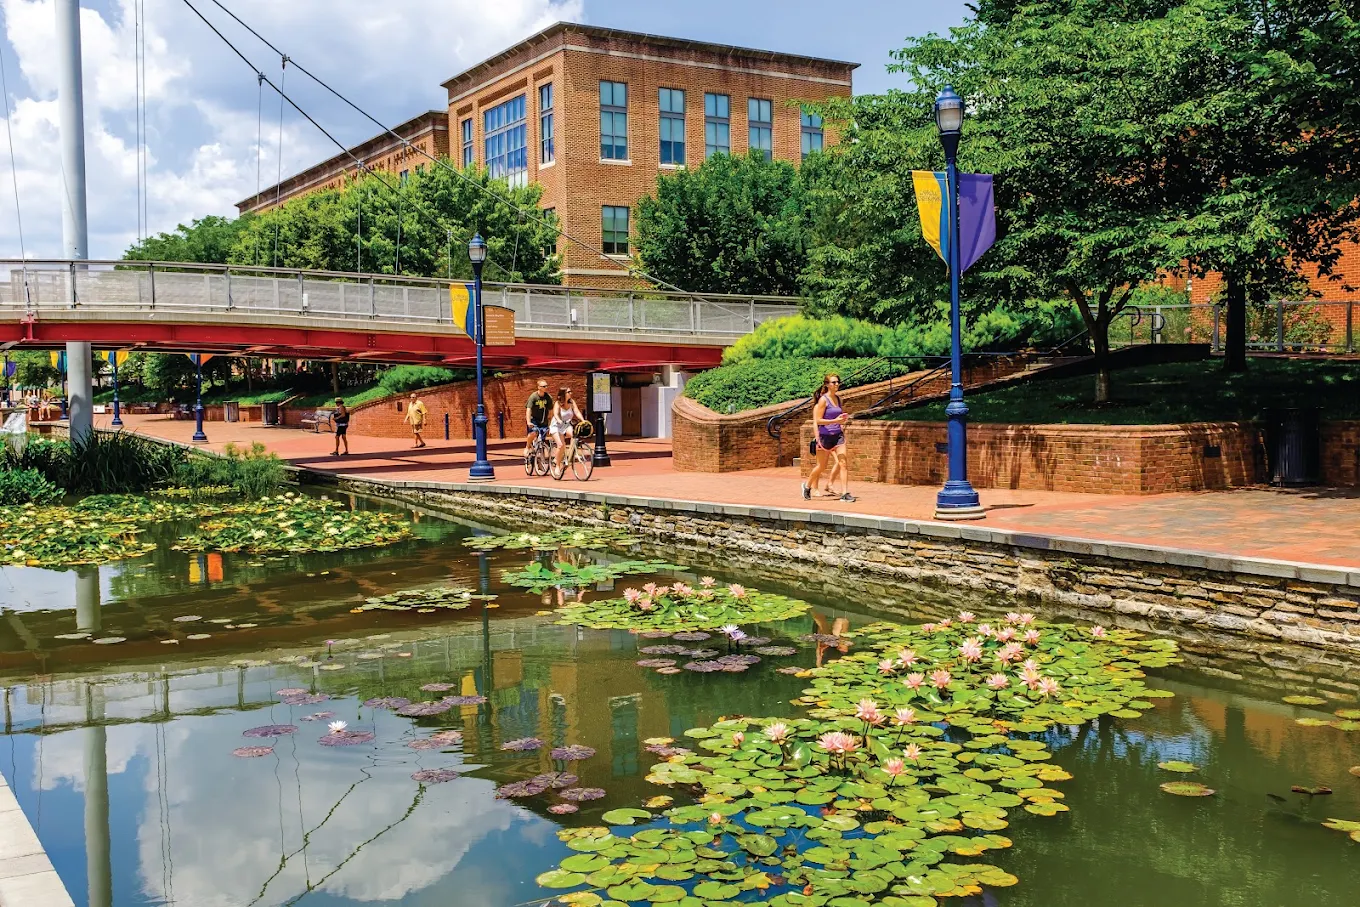
Carroll Creek Park is the linear creek-side park that threads through Downtown Frederick, lined with restaurants, galleries, and the seasonal installations the city is known for. Design Collective led the public-space and hardscape scope of the refresh: shade structures, a reimagined planting palette, and repairs to keep the City’s investment looking at its best.
The survey did double duty. Design Collective built it to capture more than its own scope strictly required, so the client could draw on the same dataset across arts, safety and other workstreams. That decision shaped everything downstream, because it meant the engagement had to hold up for several audiences at once.
A question at the beginning classified the participants: residents of the City of Frederick living outside the custom Downtown Frederick boundary were the largest group at 39.1%, followed by 25.3% from elsewhere in Frederick County, 24.5% who own a business, work at or volunteer downtown, and 19.1% living inside the boundary itself. A further 9.2% picked none of the above. Because people could choose more than one, the figures add up to more than 100%.
Participant profile
How the engagement ran
Collecting the input was the straightforward half. Reading it was the part that scales badly: when open-text comments are each tied to a spot on a map, reading every one and inferring its location by hand stops being workable somewhere in the first few hundred.
If we would have tried to do this survey with SurveyMonkey, 35 questions, I don’t know that we would have gotten this level of participation. I think people would have been bored ten questions in. With Senf the interactive mapping made this survey dynamic, interactive and memorable.
The survey ran from February 1 to April 10, 2026, combining map-based, standard, and image-preference questions. Residents could drop pins, draw routes, and mark specific areas on the map. Multiple-choice, rating-scale, star-rating, and open-text questions captured the rest. Conditional logic used each response to guide participants to the follow-up questions most relevant to them. For shade structures and planting palettes, image-preference questions let people choose between visuals—more like sorting photographs than completing a conventional survey.
Route feedback
Pin feedback
For analysis, the team leaned on heat maps instead of hand-coding. Rather than reading each comment and guessing where it belonged, Brian could slide across the map, watch where comment density clustered, then zoom into those areas to read what people were saying.
Just by moving across the result maps, you could immediately see where most comments clustered. Then you could zoom into those areas and read what people were saying—directly in the dashboard.
What the data changed
The engagement produced more than a record of public sentiment. It gave Design Collective and its client a shared, place-based evidence base for deciding where the park needed intervention and which design directions had the strongest public support. Those findings moved from the results dashboard into stakeholder conversations, design strategy, and the next round of project decisions.
Navigation and safety
The heaviest concentration of “difficult to navigate” comments sat at the vehicular-pedestrian crossings where the park meets traffic — residents wrote about crossing times too short for anyone with mobility difficulty, garage routes with no marked crossing, curb cuts that force a detour, and cars that don’t stop. That gave Design Collective a defensible basis for focused conversations with City stakeholders about exactly where to intervene. The geography did the prioritizing, so those meetings started from evidence.
Design direction
The image-preference results fed straight into the work. Design Collective built planting design strategy boards around the plant material residents selected most often, and shaped its shade-structure concepts from the visual preferences, so the engagement showed up in the boards the team was already producing.
Image-choice question
Reach across ages
At kickoff, Brian had wondered aloud whether older residents would need paper copies. The completion data answered him. Participation ran across every age band, with strong turnout among residents over 65 and a real showing in the 75-plus group.
You even had 140-some 75-plus-year-olds. In my mind, that speaks to the simplicity of the interface for people to easily participate.
The usage data filled in the rest of the picture. Women made up 65.6% of participants against 29.5% men, with 1.4% non-binary and 3.4% choosing not to answer. The most common reason for visiting was the restaurants, shops and museums along the creek, followed by the seasonal installations and the festivals. The largest group visits two or more times a week.
Where map-based engagement earns its place
Carroll Creek is a clean example of the project type where location is the unit of feedback: parks, trails, plazas, streetscapes, anywhere the useful answer is a place. A text survey makes the analyst rebuild that geography by hand. A map-based survey with heat-map synthesis hands it over directly, and the heat map stays legible enough that a stretched-thin principal can read it between other deadlines.
The second payoff is the record. Because every comment carries a location and the synthesis is visual, the firm walks into client and city conversations with an account of what the community said and where, rather than a stack of quotes. For a public-space project answering to a design team, a client and municipal stakeholders at once, that record is a deliverable in its own right.
Learn more about how landscape architecture firms use Senf for site-specific public input.
Carroll Creek started as a working survey link inside a proposal.
Send a plan or an RFPWe build a demo on it and send you the live link, usually within a day.
Project partners



About Design Collective
Design Collective is a Baltimore design firm founded in 1979, working across architecture, urban planning, landscape architecture, and interior architecture. Much of the practice sits in transit-oriented development, mixed-use design, and campus planning across the Mid-Atlantic and the East Coast. On Carroll Creek, the firm led the public-space and hardscape scope and ran the engagement itself.
designcollective.com